 |

 IBM-AUSTRIA - PC-HW-Support 30 Aug 1999
 |
Device Reliability
Device Reliability
When searching for
reliability figures, the mean time between failure (MTBF) value is a
metric commonly used. So, what is the relation to the life expectancy of
the device? Unfortunately, none. MTBF and life expectancy have no
direct relationship. The reason for this lies in the way MTBF is
calculated.
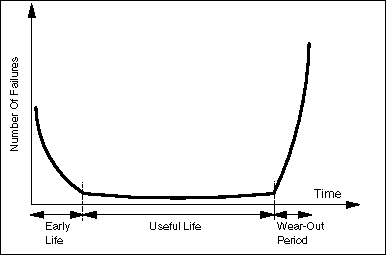
If you look at Figure 10, you see a curve expressing the
relationship between the number of failures over time for a population
of devices. As you can see, the largest number of failures will occur in
the beginning (called early life failures) and after a certain amount of
time has passed (wear-out failures). In between these two periods, there
is a phase where failures are rare and rather constant. This is called
the useful life.
MTBF values are based on failure rate during this
useful life. So no early life and no wear-out failures are taken into
account. This means that the mean time between failure will be much
higher than the life expectancy, since failures are more likely to occur
during the two phases that are not taken into account.

Figure 10. Failure Rate Bathtub Curve
So what can you do
with an MTBF value? One way to use this value is introducing it into the
Poisson formula to make a quantitative estimation of reliability. To do
this, we need to convert the MTBF to a new value: failure rate .
Failure rate will be expressed as a probability of failure during one machine
month (MM). One machine month is rounded to 730 hours. This means that
the failure rate will be equal to the inverse of the MTBF (expressed in
hours) times the hours per machine month.
If we have, for example, an
MTBF value of 100,000 hours, the failure rate will be 1/100,000 failures
per machine hours, or 730/100,000 failures per machine month.
So, the
failure rate expresses the probability (p) of a single event occurring
in a selected time period. Table 3 shows an overview of the MTBF and
this probability.
| MTBF (Khrs) |
100 |
200 |
300 |
400 |
500 |
600 |
700 |
| p (Fails/MM) |
0.0073 |
0.00365 |
0.00243 |
0.00183 |
0.00146 |
0.00122 |
0.00104 |
Table 3. Relationship of Failure Probability to MTBF
Note:
This table is based on an MTBF
calculated with a 100% duty cycle. Some publications will show an MTBF
with a lower duty cycle.
To convert these, multiply the published MTBF
with the duty cycle percentage used and divide by 100.
What is usually of interest however, is an estimate for the probability
of a certain number of failures during a defined time period. To do
this, we will use the Poisson distribution function.

Where:
| n |
Number of trials |
| p |
Probability of a single event during a selected time period (Fails/MM) |
| x |
Number of events |
| P(x) |
Probability of x events occurring in n trials |
How can we use this formula now? Let's say we have
10 devices, and we want to check them over a time period of 12 months.
This means that the number of trials will be 120 (one trial is defined
as one machine during one machine month). The value p can be obtained
from Table 3. We can now calculate the probability of a number of
failures occurring during one year on these 10 devices.
MTBF
(Khrs.) |
Probability of no
failures (x=0) |
Probability of one
failure (x=1) |
Probability of two
or more failures
(x>1) P(>1) |
| 100 |
.416 |
.365 |
.219 |
| 200 |
.645 |
.283 |
.072 |
| 300 |
.747 |
.218 |
.035 |
| 400 |
.803 |
.176 |
.021 |
| 500 |
.839 |
.147 |
.014 |
| 600 |
.864 |
.126 |
.010 |
| 700 |
.882 |
.110 |
.008 |
n=120 trials
Table 4. Probability of an Error Occurring on 10 Devices during 12 Months
Another item that is mostly unpublished in MTBF claims is the preventive and
scheduled maintenance that is done. This could significantly extend
MTBF. The main thing to remember is that when comparing MTBFs, extreme
caution should be used.
Back to 
More INFORMATION / HELP is available at the IBM-HelpCenter
Please see the LEGAL - Trademark notice.
Feel free - send a  for any BUG on this page found - Thank you.


 for any BUG on this page found - Thank you.